New Zealanders and their sheep – part 2

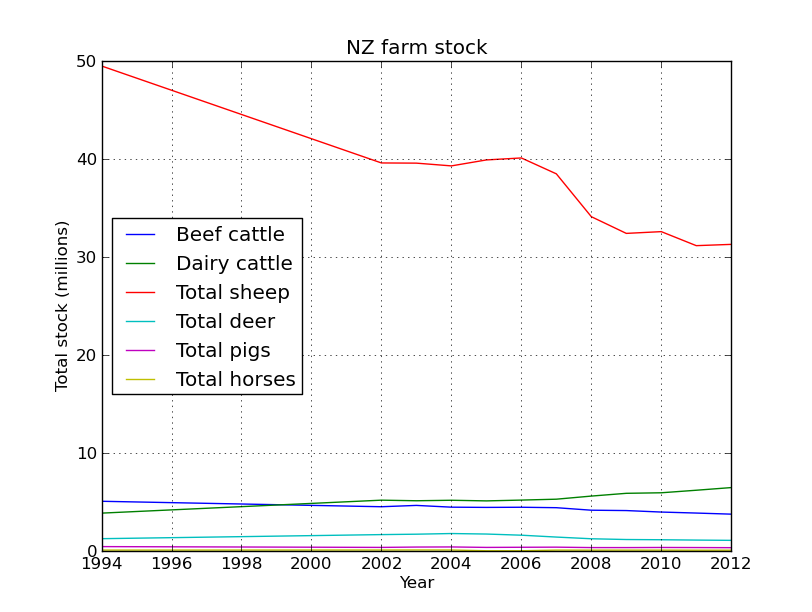
Ok, based on the graphs in the last post NZ is slowly being cow-a-fyed, so whats driving this trend. Well google will tell you that its …

WARNING: This data is dodgy, but I’m really just using it to demonstrate how cool pandas is. So I found some information on milk and lamb meet prices, we’ll load them up as dataframes and work out the percent change since 1994 like we did before. We’ll try out the datetime functionality of pandas, which is really quite nice. But first just to import our table from the last post and make the year the index so we can easily merge the new data.

import pandas as pd
per_decline = pd.DataFrame(pd.read_csv('percent_decline.csv'))
cols = per_decline.columns.values
cols[0] = 'Year'
per_decline.columns = cols
per_decline.index = per_decline['Year']
per_decline = per_decline.ix[:,1:] #all rows, skip first column (date is now the index)
per_decline.head()

	Total beef cattle	Total dairy cattle	Total sheep	Total deer	Total pigs	Total horses
Year						
1994	 0.000000	 0.000000	 0.000000	 0.000000	 0.000000	 0.000000
2002	-11.025827	 34.444950	-20.002034	 33.858009	-19.100637	 11.811093
2003	 -8.344764	 32.882482	-20.041908	 37.229441	-10.766476	 18.504488
2004	-11.895128	 34.207998	-20.609926	 42.707754	 -8.072078	 13.376472
2005	-12.366101	 32.506699	-19.379727	 38.499840	-19.230733	-100.000000

Now we are going to create a table from the dodgy lamb price data, this table is in a slightly different format so we will have to use the groupby method to wrangle it into the shape we need.

lamb_data = pd.DataFrame(pd.read_excel('lamb_usd.xlsx',sheetname='lamb'))
lamb_data.head()
	Month	Price	Change
0	 Apr 1994	 130.00	 -
1	 May 1994	 126.59	 -2.62 %
2	 Jun 1994	 127.03	 0.35 %
3	 Jul 1994	 126.11	 -0.72 %
4	 Aug 1994	 119.62	 -5.15 %

Now to use datetime to make an index based on the month data.

lamb_data.index = pd.to_datetime(lamb_data['Month'])
lamb_data=lamb_data.ix[:,1:2] #just grab the price
lamb_data.head()
	Price
Month	
1994-04-02	 130.00
1994-05-02	 126.59
1994-06-02	 127.03
1994-07-02	 126.11
1994-08-02	 119.62

Pandas did a good job of converting the date format into a datetime index. As you’ll see in a second this datetime object has some extra functionality that makes dealing with dates a breeze. Although this new data has the date and price information we need, its divided into quarterly amounts. As you can see by the commented out code, initially I made a mistake and summed these values, but really we want the mean to get the average yearly price. I left the mistake code there as it shows how easy it would have been to get the sum using groupby.

#wrong! lamb_prices = lamb_data.groupby(lamb_data.index.year)['Price'].sum()
lamb_prices = lamb_data.groupby(lamb_data.index.year)['Price'].mean()
lamb_prices = pd.DataFrame(lamb_prices[:-1]) #get rid of 2014
lamb_prices.head()
	Price
1994	 124.010000
1995	 113.242500
1996	 145.461667
1997	 150.282500
1998	 116.013333

We pass the year index to groupby and get it to do its magic on the price column (our only column in this case, but you get the idea), we then just call the mean method to return the mean price per year. The datetime object made specifying the year easy. Now we are going to write a quick function to calculate the percent change since 1994.

def percent(start,data):
    '''calculate percent change relative to first column (1994), better than previous attempt )-:'''
    ans = 100*((start - data)/start)
    return 0-ans

lamb_change = percent(lamb_prices.Price[1994],lamb_prices)
lamb_change.head()
	Price
1994	 0.000000
1995	 -8.682768
1996	 17.298336
1997	 21.185791
1998	 -6.448405

Great! Now just add that column to our original dataframe. Notice how only the intersect of the dates are used, very handy (ie it drops 1995-2001 from the lamb price data as these dates are not in our stock number table)!

per_decline['Lambprice'] = lamb_change
per_decline.head()
	Total beef cattle	Total dairy cattle	Total sheep	Total deer	Total pigs	Total horses	Lambprice
Year							
1994	 0.000000	 0.000000	 0.000000	 0.000000	 0.000000	 0.000000	 0.000000
2002	-11.025827	 34.444950	-20.002034	 33.858009	-19.100637	 11.811093	 17.768056
2003	 -8.344764	 32.882482	-20.041908	 37.229441	-10.766476	 18.504488	 28.869984
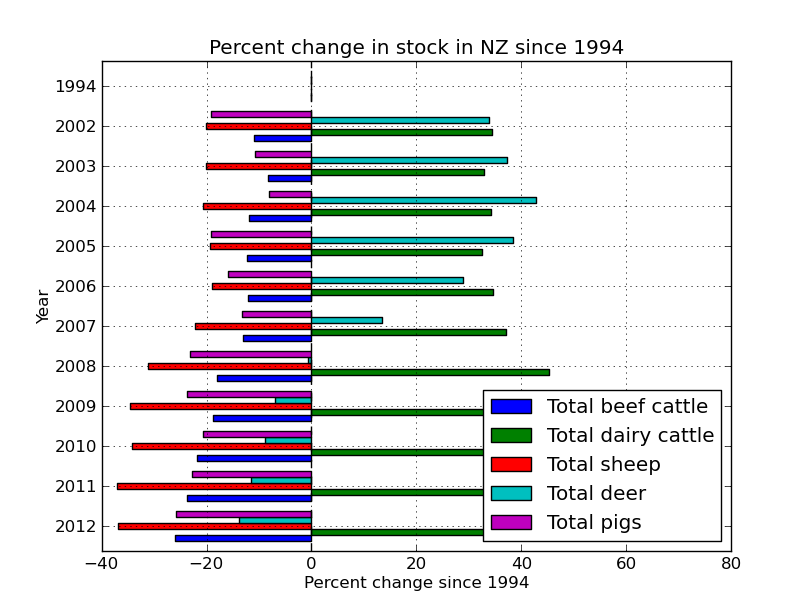
per_decline.index=per_decline.index.astype(int) #lamb2
per_decline.plot(kind='barh')
plt.title('Percent change in stock in NZ since 1994')
plt.xlabel('Percent change since 1994')
plt.ylabel('Year')

fig_9


The next series of code and graphs adds in milk and lamb prices to try and see why farmers are moving from ovines to bovines!

milk_data = pd.DataFrame(pd.read_excel('milk_prices_usd.xlsx',sheetname='milk'))
milk_data.index=milk_data['year']
milk_data.head()
	year	thousand head	pounds	mill lbs	price_cwt
year					
1989	 1989	 10046	 14323	 143893	 13.56
1990	 1990	 9993	 14782	 147721	 13.68
1991	 1991	 9826	 15031	 147697	 12.24
1992	 1992	 9688	 15570	 150847	 13.09
1993	 1993	 9581	 15722	 150636	 12.80
#get rid of the info we don't need
milk_data = pd.DataFrame(milk_data.ix[5:,:])
milk_change = percent(milk_data.price_cwt[1994],milk_data)
per_decline['milk_price'] = milk_change
per_decline.head()
	Total beef cattle	Total dairy cattle	Total sheep	Total deer	Total pigs	Total horses	Lambprice	milk_price
Year								
1994	 0.000000	 0.000000	 0.000000	 0.000000	 0.000000	 0.000000	 0.000000	 0.000000
2002	-11.025827	 34.444950	-20.002034	 33.858009	-19.100637	 11.811093	 17.768056	 -6.630686
2003	 -8.344764	 32.882482	-20.041908	 37.229441	-10.766476	 18.504488	 28.869984	 -3.469545
2004	-11.895128	 34.207998	-20.609926	 42.707754	 -8.072078	 13.376472	 33.670672	 23.747109
2005	-12.366101	 32.506699	-19.379727	 38.499840	-19.230733	-100.000000	 29.762385	 16.653816
per_decline.plot(kind='barh')

lamb_3 These graphs are a little busy, lets just concentrate on the important stuff.

<pre>animals=['Total dairy cattle','Total sheep','Lambprice','milk_price']
interesting_data=per_decline[animals]
interesting_data.plot(kind='barh')

lamb_4

interesting_data.plot()

Finally!

lamb_5

Advertisement

Pandas data analysis – New Zealanders and their sheep!

Featured

As an Aussie I cop a little bit of flack living in New Zealand. It helps that since I’m from the South of Australia I follow Aussie Rules footy, not this rugby shenanigans, so I don’t bother too much with the constant focus on how much better the All Blacks are relative to our poor Wallabies (Australia has won as many world cups as New Zealand – Take that!).

They make bloody good gum boots (multi-purpose - inside joke (-; )

Kiwi’s have bloody good gum boots; they have to do more than keep the mud off! – inside joke (-;

That said as a bit of fun I thought I would do a post on the Pandas python module using data from StatsNZ. It has too be about sheep right! The actual spreadsheet I downloaded from StatsNZ and used in this is here.

I’ll be using pandas, ipython, and matplotlib to create some graphs to show the decline of sheep in NZ. In the next post I’ll try and work out why (yes I know you could find this out in 3 seconds with google, but thats no fun).

First we will read the file using pandas and make a dataframe. Pandas can import in all kinds of file formats, with excel you need to include a sheet name (that little tab at the bottom of the excel sheet).

#imports
import pandas as pd
import matplotlib.pyplot as plt
#sheetname required for xlsx
data_file = pd.read_excel('livestock1.xlsx',sheetname='livestock')

#make a dataframe
data = pd.DataFrame(data_file)
data.head()
Out[8]:
                                                 1994          2002      2003  \
Total beef cattle                             5047848       4491281   4626617
Calves born alive to beef heifers/cows        1262522       1083485   1079334
Total dairy cattle                            3839184       5161589   5101603
Calves born alive to dairy heifers/cows       2455975       3225238   3115897
Total sheep                              4.946605e+07  3.957184e+07  39552113
-----
                                             2010      2011      2012
Total beef cattle                         3948520   3846414   3734412
Calves born alive to beef heifers/cows     901258    901375    827749
Total dairy cattle                        5915452   6174503   6445681
Calves born alive to dairy heifers/cows   3640914   3884257   3879543
Total sheep                              32562612  31132329  31262715

So we made a dataframe, the head method acts like bash head in that it shows the start of the frame rather than the whole thing. Currently the years are columns and the stock type are rows, lets flip the table, which is super easy!

 #we really want the dates as the index
data = data.T
data.head()
-------
     Total beef cattle Calves born alive to beef heifers/cows  \
1994           5047848                                1262522
2002           4491281                                1083485
2003           4626617                                1079334
2004           4447400                                1013893
2005           4423626                                1018730

Now that we have the years as rows, actually an index, it will be much easier to do our plotting. But the column names are overly informative, as in long, lets shorten them.

#the column names are pretty long, lets fix that now
data.columns
Out[13]: Index([u'Total beef cattle', u'Calves born alive to beef heifers/cows', u'Total dairy cattle', u'Calves born alive to dairy heifers/cows', u'Total sheep', u'Total lambs marked and/or tailed', u'Total deer', u'Fawns weaned', u'Total pigs', u'Piglets weaned', u'Total horses'], dtype=object)
sub_data = data.loc[:,['Total beef cattle','Total dairy cattle','Total sheep','Total deer',
'Total pigs','Total horses']]
sub_data = sub_data.replace('..',0)#replace .. with 0
sub_data = sub_data.astype('float')
sub_data.head()
Out[17]:
      Total beef cattle  Total dairy cattle  Total sheep  Total deer  \
1994            5047848             3839184     49466054     1231109
2002            4491281             5161589     39571837     1647938
2003            4626617             5101603     39552113     1689444
2004            4447400             5152492     39271137     1756888
2005            4423626             5087176     39879668     1705084
2006            4439136             5169557     40081594     1586918
2007            4393617             5260850     38460477     1396023
2008            4136872             5578440     34087864     1223324
2009            4100718             5860776     32383589     1145858
2010            3948520             5915452     32562612     1122695
2011            3846414             6174503     31132329     1088533
2012            3734412             6445681     31262715     1060694

Great! Now to make the plot easier to look at lets divide the dataframe by 1 million.

#now divide by a million
sub_data = sub_data.divide(1000000)
#first plot everything
sub_data.plot(legend=True)
plt.xlabel('Year')
plt.ylabel('Total stock (millions)')
plt.title('NZ farm stock')

Yes that is correct, back in the 90’s there were 50 million sheep in NZ, not bad for a country with a population of ~3 million people. Baa. But their numbers have been in serious decline since then, replaced by their bigger brothers the cows.
Poor sheepies!

Lets face it, NZ is all cows and sheep, lets just look at that data.

#lets just plot cows and sheep, that being the first 3 columns
cow_sheep = sub_data.ix[:,[0,1,2]]
cow_sheep.plot(label=True,title="Numbers of cattle and sheep in NZ")
plt.xlabel('Year')
plt.ylabel('Total stock (millions)')

fig2The data has meat cows and milk cows as separate columns, its easy to combine them.

#a milk cow and meat cow are still cattle
cow_sheep['Total cows'] = cow_sheep.ix[:,0] +  cow_sheep.ix[:,1]
cow_sheep.ix[:,2:].plot(legend=True,title="Total cattle and sheep in NZ")
plt.xlabel('Year')
plt.ylabel('Total stock (millions)')

fig_3So the country is cowafying, mostly dairy replacing beef cattle. Although the increase looks slight, basically its 25% up! That’s a lot of grass, cow shit, and methane!

Now lets look at the change in the numbers of each stock since 1994 (the start of our data). We do this by passing all the data as well as all the data minus 1994 to a function that handles the calculation. Pandas handles this all in the back end and parses the data in the frame through the function, nice.

def percent(dataframe,d1):
    '''calculate percent change relative to first column (1994)'''
    a = 100*((dataframe.ix[0,:]-d1)/dataframe.ix[0,:])
    return 0-a

#pass the entire data frame to this function
percent_data = percent(sub_data,sub_data.ix[0:,:])

percent_data.head()
Out[38]: 
      Total beef cattle  Total dairy cattle  Total sheep  Total deer  \
1994           0.000000            0.000000     0.000000    0.000000   
2002         -11.025827           34.444950   -20.002034   33.858009   
2003          -8.344764           32.882482   -20.041908   37.229441   
2004         -11.895128           34.207998   -20.609926   42.707754   
2005         -12.366101           32.506699   -19.379727   38.499840   

      Total pigs  Total horses  
1994    0.000000      0.000000  
2002  -19.100637     11.811093  
2003  -10.766476     18.504488  
2004   -8.072078     13.376472  
2005  -19.230733   -100.000000  
#the years are plotted as floats, its easy to convert them!
percent_data.index=percent_data.index.astype(int)
#figure 4
percent_data.index=percent_data.index.astype(int)
percent_data.plot(kind='barh')
plt.title('Percent change in stock in NZ since 1994')
plt.xlabel('Percent change since 1994')
plt.ylabel('Year')

fig_4I really want the graph the other way around, so lets re-index. Also, lets get rid of the nags, they look funny because the frame was missing some data. More proof that Far Lap was an Australian horse.

horseless = sub_data.ix[:,:-1]
horseless_per = percent(horseless,horseless.ix[0:,:])
#flip the axis
horseless_per = horseless_per.reindex( index=data.index[ ::-1 ] )
horseless_per.index=horseless_per.index.astype(int)
horseless_per.plot(kind='barh')
plt.title('Percent change in stock in NZ since 1994')
plt.xlabel('Percent change since 1994')
plt.ylabel('Year')

fig_8

Finally, its silly having the 1994 data as its zero, but it was a nice sanity check to make sure the % function was working correctly. But lets get rid of it now by just plotting part of the frame.

horseless_per[:-1].plot(kind='barh')
plt.title('Percent change in stock in NZ since 1994')
plt.xlabel('Percent change since 1994')
plt.ylabel('Year')

The ‘barh’ is just bar graph horizontal.
fig_9So it looks like there was a venison craze in the early 00’s, but mostly just more and more dairy.

#save the file
horseless_per.to_csv('stock_num_diff_average.csv')

Ok, so although there are still a LOT of sheep in NZ, it really is the country of the cow now. What might be driving that? Lets look at some commodity prices in the next post!

Basic data plotting with ipython and pandas

I’ve posted before on how much I love plotting in python using pandas, matplotlib, and ipython. But I thought I would do a blog post that would contain some important ‘bookmarks’ on how to do some essential plotting tasks. Just as a simple example of how pandas could be used in a biological sense, how about we make a dataframe from a blast table outputted from NCBI BLAST. The example data is just a blast search using transcripts as a qry with output option 8, which creates a tabular output that is nice for parsing using scripts. Note, if you want to use my table go for it, its here as an tab-delimited Excel spreadsheet, for this example I just copied it into a text document called ‘blast_output.txt’ – I can’t upload txt files at wordpress)-:)

1) Basic table manipulations and very simple excel-like maths functions.

Normally I probably would pre-process the data using a simple python script, but here I’ll do it all in pandas.

from pandas import Series,DataFrame
import matplotlib.pyplot as plt
import pandas as pd
blast_data = pd.read_table('blast_output.txt',header = 0)
blast_data = DataFrame(blast_data)
blast_data.head()

#          QUERY  NUMHITS                                            HITDESC  \
#0  Sequence_7116        1  ref|XP_004521769.1| PREDICTED: M-phase phospho...   
#1  Sequence_7117        1  ref|XP_002059188.1| GJ16167 [Drosophila virili...   
#2  Sequence_7118        1  ref|XP_002008154.1| GI11977 [Drosophila mojave...   
#3  Sequence_7119        1  ref|XP_001955873.1| GF24906 [Drosophila ananas...   
#4  Sequence_7120        1  ref|XP_004520750.1| PREDICTED: proteoglycan 4-...   
#
#   NUMHSP           EVAL  BITSCORE  PERCENTIDENT  PERCENTCONSERV  QUERYCOV  \
#0       1   2.000000e-44       158      0.702290        0.793893  0.511719   
#1       1  1.000000e-175       502      0.766667        0.886667  0.853081   
#2       3   1.000000e-46       132      0.680412        0.762887  0.126928   
#3       1   2.000000e-62       211      0.452830        0.577358  0.716599   
#4       2   0.000000e+00       734      0.514886        0.643608  0.577610   

#     HITCOV  
#0  0.796178  
#1  0.974026  
#2  0.572414  
#3  0.933824  
#4  0.650243

So now we have the blast table stored as a pandas data frame, it might be a good time to show how to splice and dice this frame so that it shows information that we are interested in. Firstly, column and index headings are easy to access using (in this example) “blast_data.columns” and “blast_data.index”. To grab a column is simple:

blast_data['QUERY']
##output##
0     Sequence_7116
1     Sequence_7117
2     Sequence_7118
3     Sequence_7119
4     Sequence_7120
5     Sequence_7121
......

To slice section of the table we would use “blast_data.ix”. As this is a two demensional table sometimes its a little tricky to workout how “ix” works. But its quite simple really, its just the two dimensions separated by a comma, with the row range first and columns second, remembering that as this is python counting starts at 0! So for some easy examples, lets see how to get the first line and all rows (1), first 10 rows and 3 columns (2), first 10 rows and last 2 columns (3). As you can see its just normal python list splicing but in 2 dimensions.

#first line and all rows (1)
blast_data.ix[0:0,:] #index 0 to 0 ie first row and ":" columns ie all of them
###output###
 QUERY  NUMHITS                                            HITDESC  \
0  Sequence_7116        1  ref|XP_004521769.1| PREDICTED: M-phase phospho...   
   NUMHSP          EVAL  BITSCORE  PERCENTIDENT  PERCENTCONSERV  QUERYCOV  \
0       1  2.000000e-44       158       0.70229        0.793893  0.511719   
     HITCOV  
0  0.796178  

#first 10 rows and 3 columns (2) 
 blast_data.ix[0:10,0:3] #standard python slice
###output####
            QUERY  NUMHITS                                            HITDESC
0   Sequence_7116        1  ref|XP_004521769.1| PREDICTED: M-phase phospho...
1   Sequence_7117        1  ref|XP_002059188.1| GJ16167 [Drosophila virili...
2   Sequence_7118        1  ref|XP_002008154.1| GI11977 [Drosophila mojave...
3   Sequence_7119        1  ref|XP_001955873.1| GF24906 [Drosophila ananas...
4   Sequence_7120        1  ref|XP_004520750.1| PREDICTED: proteoglycan 4-...
5   Sequence_7121        1  ref|XP_004537614.1| PREDICTED: protein suppres...
6   Sequence_7122        1  ref|XP_002073069.1| GK13353 [Drosophila willis...
7   Sequence_7123        1  ref|XP_001981946.1| GG11315 [Drosophila erecta...
8   Sequence_7124        1  ref|XP_002052580.1| GJ17621 [Drosophila virili...
9   Sequence_7125        1  ref|XP_002007909.1| GI13202 [Drosophila mojave...
10  Sequence_7126        1  ref|XP_004520332.1| PREDICTED: nucleolar prote...

#first 10 lines and last 2 rows (3)
blast_data.ix[0:10,-2:] #standard python again, '-2' is 2 from end
###output### 
    QUERYCOV    HITCOV
0   0.511719  0.796178
1   0.853081  0.974026
2   0.126928  0.572414
3   0.716599  0.933824
4   0.577610  0.650243
5   0.312649  0.376129
6   0.615196  0.996016
7   0.934222  1.000000
8   0.840226  1.000000
9   0.157009  0.342857
10  0.837484  0.960961

The great thing about the pandas dataframe is you can do excel like maths work using the table, for example firstly lets just look at E-values < 1E-100.

good_hits = blast_data[blast_data['EVAL']<1e-100]
len(good_hits)
#output 576
good_hits.head()

###output####
           QUERY  NUMHITS                                            HITDESC  \
1  Sequence_7117        1  ref|XP_002059188.1| GJ16167 [Drosophila virili...   
4  Sequence_7120        1  ref|XP_004520750.1| PREDICTED: proteoglycan 4-...   
5  Sequence_7121        1  ref|XP_004537614.1| PREDICTED: protein suppres...   
6  Sequence_7122        1  ref|XP_002073069.1| GK13353 [Drosophila willis...   
7  Sequence_7123        1  ref|XP_001981946.1| GG11315 [Drosophila erecta...   

   NUMHSP           EVAL  BITSCORE  PERCENTIDENT  PERCENTCONSERV  QUERYCOV  \
1       1  1.000000e-175       502      0.766667        0.886667  0.853081   
4       2   0.000000e+00       734      0.514886        0.643608  0.577610   
5       2  1.000000e-108       390      0.438655        0.605042  0.312649   
6       1  1.000000e-112       342      0.648221        0.833992  0.615196   
7       1   0.000000e+00      1845      0.513501        0.672667  0.934222   

     HITCOV  
1  0.974026  
4  0.650243  
5  0.376129  
6  0.996016  
7  1.000000

We can even collect the best hits by sorting by the EVAL column.

best_hits.sort('EVAL',inplace=True)
best_hits.head()
###output##
            QUERY  NUMHITS  \
501  Sequence_7617        1   
400  Sequence_7516        1   
754  Sequence_7870        1   
398  Sequence_7514        1   
755  Sequence_7871        1   

                                               HITDESC  NUMHSP  EVAL  \
501  ref|XP_004525475.1| PREDICTED: kelch domain-co...       1     0   
400  ref|XP_001362065.2| GA19724 [Drosophila pseudo...       1     0   
754  ref|XP_004524178.1| PREDICTED: mitogen-activat...       1     0   
398  ref|XP_004523028.1| PREDICTED: sphingosine kin...       1     0   
755  ref|XP_004536256.1| PREDICTED: V-type proton A...       1     0   

     BITSCORE  PERCENTIDENT  PERCENTCONSERV  QUERYCOV    HITCOV  
501       691            74        0.863248  0.537193  0.902724  
400       842            61        0.744382  0.904181  0.973574  
754      2147            73        0.837891  0.934356  0.965003  
398       636            53        0.680445  0.797900  0.993399  
755       897            84        0.897143  0.379302  0.949367

Some *very* simple math might be to convert the percent identity into a percentage value

good_hits['PERCENTIDENT'] = good_hits['PERCENTIDENT']*100
good_hits['PERCENTIDENT'] = good_hits['PERCENTIDENT'].astype(int)

Of course you could do a lot more complex excel type maths than that, but hopefully you get the idea!

2) Histograms – everyone loves a good histogram.

For this histogram how about we collect information from a blast search and parse out the species, so that we can look at histogram of ‘species richness’ in the best BLAST hits. In this format column 3 contains a hit descriptor that also lists the species name in square brackets (ie [Nasonia vitripennis]). So I want to parse out that information, collect all the totals, and plot the most frequent 10 (for example).  We really only need the species part, so we discard the genus information to avoid problems with all those contaminating Drosophila genomes in the database (-;

Now we are really interested in the column “HITDESC”. What we want is just the frequency distribution of the species in the square brackets, all the other info is not required for a histogram.

desc = blast_data['HITDESC']
desc
###output###
0     ref|XP_004521769.1| PREDICTED: M-phase phospho...
1     ref|XP_002059188.1| GJ16167 [Drosophila virili...
2     ref|XP_002008154.1| GI11977 [Drosophila mojave...
3     ref|XP_001955873.1| GF24906 [Drosophila ananas.
......

Although names are descriptions are incomplete this is just a display issue, the data is still there. First we will write a quick filtering function to grab the species name, then use list comprehension to make a collection of names, finally, we will use another function to count each occurrence of the names in the list.

def species(desc):
    #a function to pull out the species name from [species genus]
    line = line.split(' [')[1] #get species genus
    line = line.split(' ')[0] #trim off genus part
    return line

def counter(seq):
    """make a freq dict with species as key"""
    seq_dict = {}
    for n in seq:
        if n in seq_dict:
            seq_dict[n] += 1
        else:
            seq_dict[n] = 1
    return seq_dict

desc_list = [species(des) for des in desc] #make a list of names
###output###
['Ceratitis',
 'Ceratitis',
 .......
 'Ceratitis',
 'Oikopleura']

desc_dict = counter(desc_list)
#lambda magic to get a sorted list from an unsorted dictionary
most_freq8 = sorted(spec_dict,key=lambda x:spec_dict[x],reverse=True)[:8]
#if you wanted to check this works
#chk = spec_dict.values()
#chk.sort()
#chk[-8:]#show last ten values, crossref these against diction usin#g key as most freq species from most_freq8

Nearly there, you’ll probably notice our most_freq8 list is no good for a histogram because we have lost our frequency information. We can get it back using some functional programing magic (BTW for an excellent run through of functional programing in python check out the great how-to-here here).

most_freq_dict = dict(((spec,spec_dict[spec]) for spec in most_freq8)) 
most_freq_dict
###output###
{'Acyrthosiphon': 7,
 'Aedes': 8,
 'Anopheles': 6,
 'Ceratitis': 501,
 'Drosophila': 388,
 'Glossina': 7,
 'Musca': 7,
 'Sarcophaga': 8}

Briefly, a dictionary can be created from tuple of key value pairs, so all we do here is use list comprehension to combine the “spec_dict” frequency counts with the keys from the most frequent list to create a new dictionary. As it turns out, dictionaries can be converted directly to pandas dataframes, however, this will create a frame with all the species as column headings. We could flip the axes using DataFrame.transpose fucntion, but that is messy. Instead we will use list comprehension again to reformat the data (Yes I know I probably could have done this a few steps ago to avoid all this data mushing).

hist_data = DataFrame([[key,most_freq_dict[key]] for key in most_freq_dict])
hist_data
###output###
               0    1
0          Musca    7
1          Aedes    8
2     Drosophila  388
3      Anopheles    6
4      Ceratitis  501
5  Acyrthosiphon    7
6     Sarcophaga    8
7       Glossina    7
#need the index to be the species to get them to display

Great, sort of! Really, we want the species names to be the index so they are displayed in the histogram, we could just re-index from here, but lets re-make the table directly specifying that we want the index to be the key from the dictionary

hist_data = DataFrame([most_freq_dict[key] for key in most_freq_dict],columns = ['Frequency'],index=most_freq_dict.keys())
hist_data #we use the same dictionary(most_freq_dict) for columns and index, so this will work!
###Output### 
                 Frequency
Musca            7
Aedes            8
Drosophila     388
Anopheles        6
Ceratitis      501
Acyrthosiphon    7
Sarcophaga       8
Glossina         7

We can make a histogram directly from out dataframe, sweet.

fig = plt.figure()
axes = fig.add_subplot(1,1,1)
axes.set_ylabel("Species")
axes.set_xlabel("Frequency")
axes.set_title("Bla bla")
hist_data.hist(kind='barh',ax=axes,legend=False)

basic_pandas_hist

Finally, we really want the data_frame sorted by size to make the histogram look a little nicer.

hist_data = hist_data.sort('Frequency',ascending=False) #not in place
axes = fig.add_subplot(1,1,1)
axes.set_ylabel("Species")
axes.set_xlabel("Frequency")
axes.set_title("Bla bla")
hist_data.hist(kind='barh',ax=axes,legend=False)

basic_pandas_hist2

Pandas, matplotlib and Ipython – all you need for great data anaylsis

I’ve been playing around a little with the stats-centric programming language R, mostly to get a better handle on the Bioconductor differential gene expression analysis packages edgeR and DEseq. The language is designed to allow for easy manipulation of tabular data as well as providing access to a rich library of statistical packages and graphing tools. One thing I learned was that often it was more efficient (at least for me) to spend a little time pre-formatting the data using python/perl before even getting started with R. The charting features of R are pretty cool, but once again I missed my familiar Python environment)-:

But, as always there is a Pythonic way, I came across a great book called Python for Data Analysis by Wes McKinney. The book introduced me to the pandas library, which contains R-like tools for tabular data manipulations and analyses. The book also introduced the Ipython development environment; basically a souped up feature rich but light weight “python IDLE”. The best features of Ipython for me are the logging capabilities, advanced history and de-bugging utilities – very cool! Ipython has been designed to work well with the matplotlib, thus allowing production and manipulation of nice looking graphs and charts within an interactive python environment. I’m still very much learning this (and I’m a hack programmer), but here is some fun data crunching based on a USDA food database wrangled into into Json format by Ashley Williams.

Ok, I think it would look better on one chart. Here is the top 50 protein containing foods with their fat content as part of one graph.

Note that I chopped the y-axis labels off, doh, no problem just modify them in real time using the slider editor!

Not too bad at all for a newbee. Hopefully by next post I will feel a little more comfortable to share some hard learned lessons on data manipulation using pandas.